PZLAST Help
(日本語ヘルプページはこちら)
1. Submit a new job.

-
Using PZLAST, you can search protein sequences against terabytes of public metagenomic data
and examine their distribution on Earth.
- Query File
- Only a FASTA-formated file for **protein** sequences is acceptable. (not for DNA sequences) Either a single FASTA or MultiFASTA-formatted file is accepted as input. Paste the input sequence into the box (B) or click the button (C) to select a file.
- Parameters
- PZLAST has the following parameters.
- "Search mode" (D)
- You can choose "Environment Search" mode to limit the search to specific environments, or "Single Sample Search" mode to search for a specific single sample. By default, the search is conducted across all environments.
- "Output top N hits" (E)
- This controls how many hits will be output per input sequence. You can set it for top hit (output=1) only, but higher values will give more enjoyable results.
- E-value cut-off (F)
- You can set the cutoff value for the E-value, which defaults to 1e-8. Lowering this value allows you to narrow down the search results to sequences with higher similarity, although it may result in fewer hits.
- Press the submit button (G) to register the job.
- Input file size limit
- All sequences must be >= 10 AA (amino acids) and <= 2,000 AA. The number of input sequences must be <= 10,000. The number of total amino acids must be <= 100,000. The number of possible output must be <= 1,000,000.
Go to the top page or click "Query" in navigation tabs (A).
-
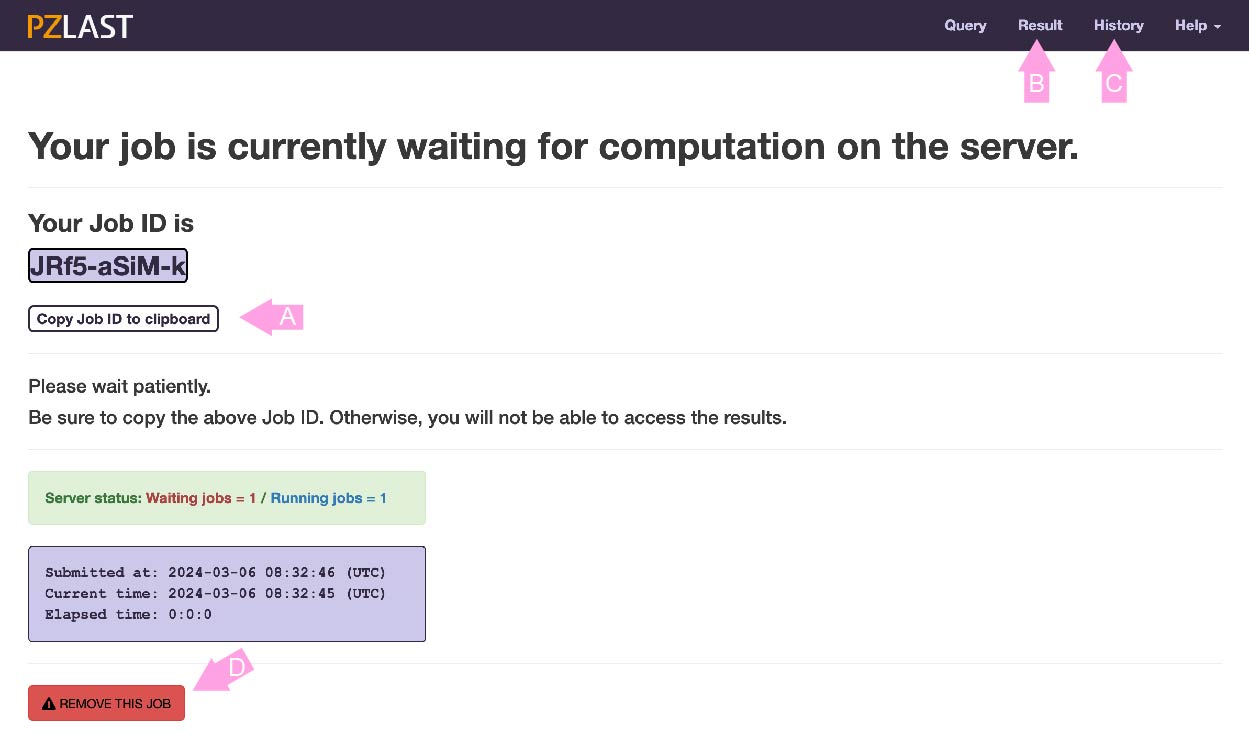
After registering the job, the screen changes to the job status page.
This page shows whether the job is currently WATING to execute the calculation on ZettaScaler-3.0 or is RUNNING on it.
This page is refreshed every few seconds. If the calculation is completed (or unfortunately ends with an error or no-hit), this page will automatically transition to the results page.
All jobs are managed with a unique job ID issued at the time of registration.
If you leave this page, press the copy button (A) and copy the job ID to the clipboard (or somewhere else). You can return to this page again by click the "Result" in the navigation tab (B) and entering the job ID. You can also go back to past jobs from the "History" page (C). Please note that jobs are deleted two weeks after registration.
Note: This site uses cookies to record your job history. Only job ID and registration time are recorded in cookie. If "History" is not displayed, please enable cookies in your browser.
Click the "REMOVE THIS JOB" button (D) if you want to delete the waiting job.
2. Result pages.
- Information page
-
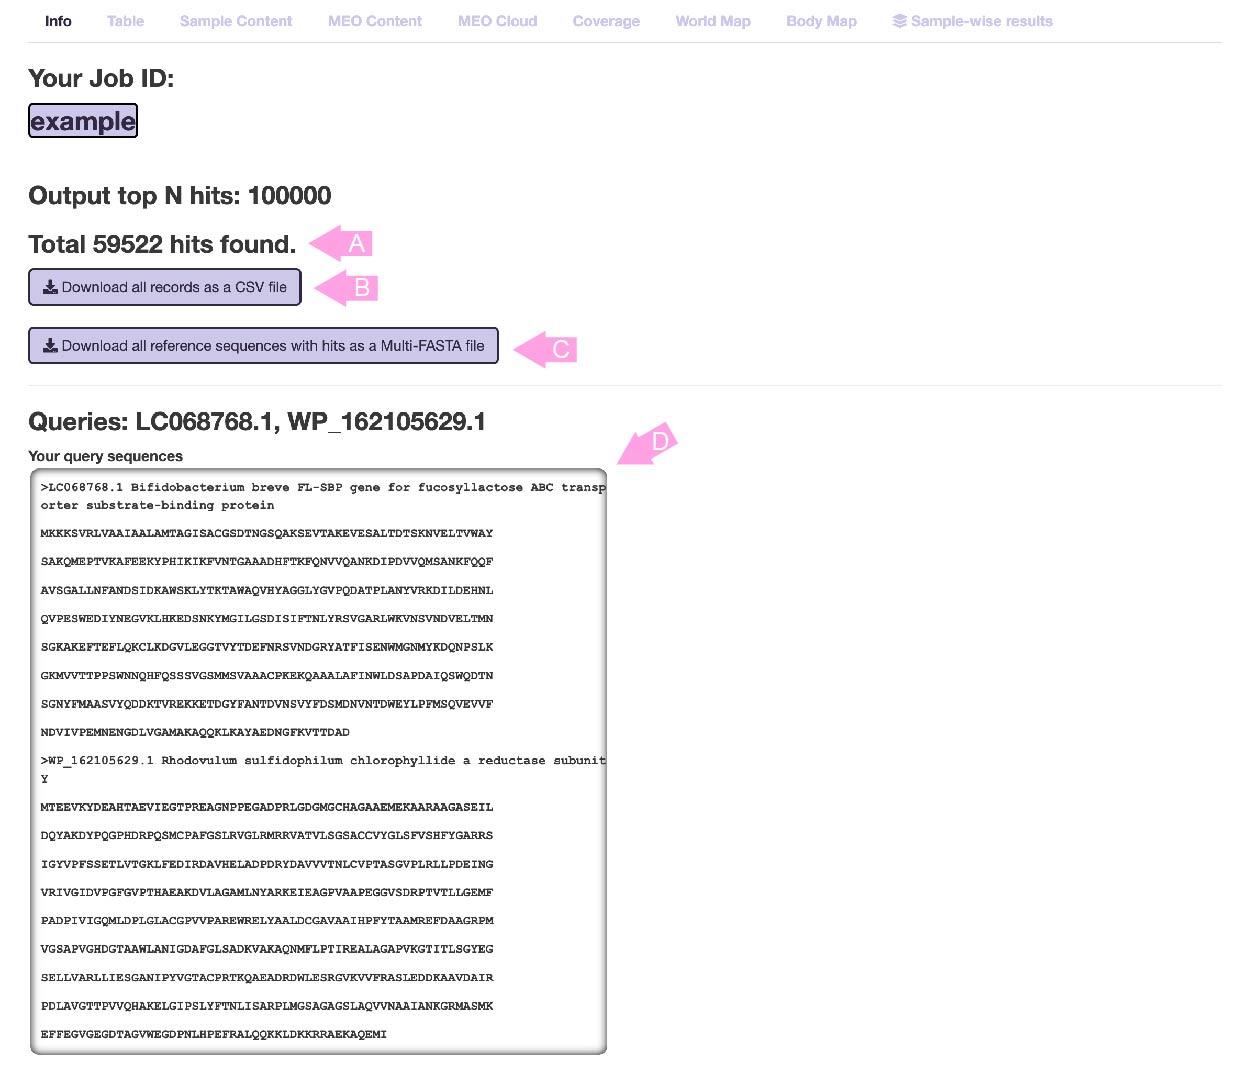
When the calculation is completed, this page will be displayed first.
The total number of hits (or the sum of hits when multi-FASTA is input) is displayed in (A).
Press button (B) to download all results in CSV format.
Press button (C) to download all the hit reference sequences in Multi-FASTA format.
The input information is displayed in (D). All results are distinguished by the sequence ID displayed in "Queries", so remember these IDs when checking the results page below.
- Table results
-
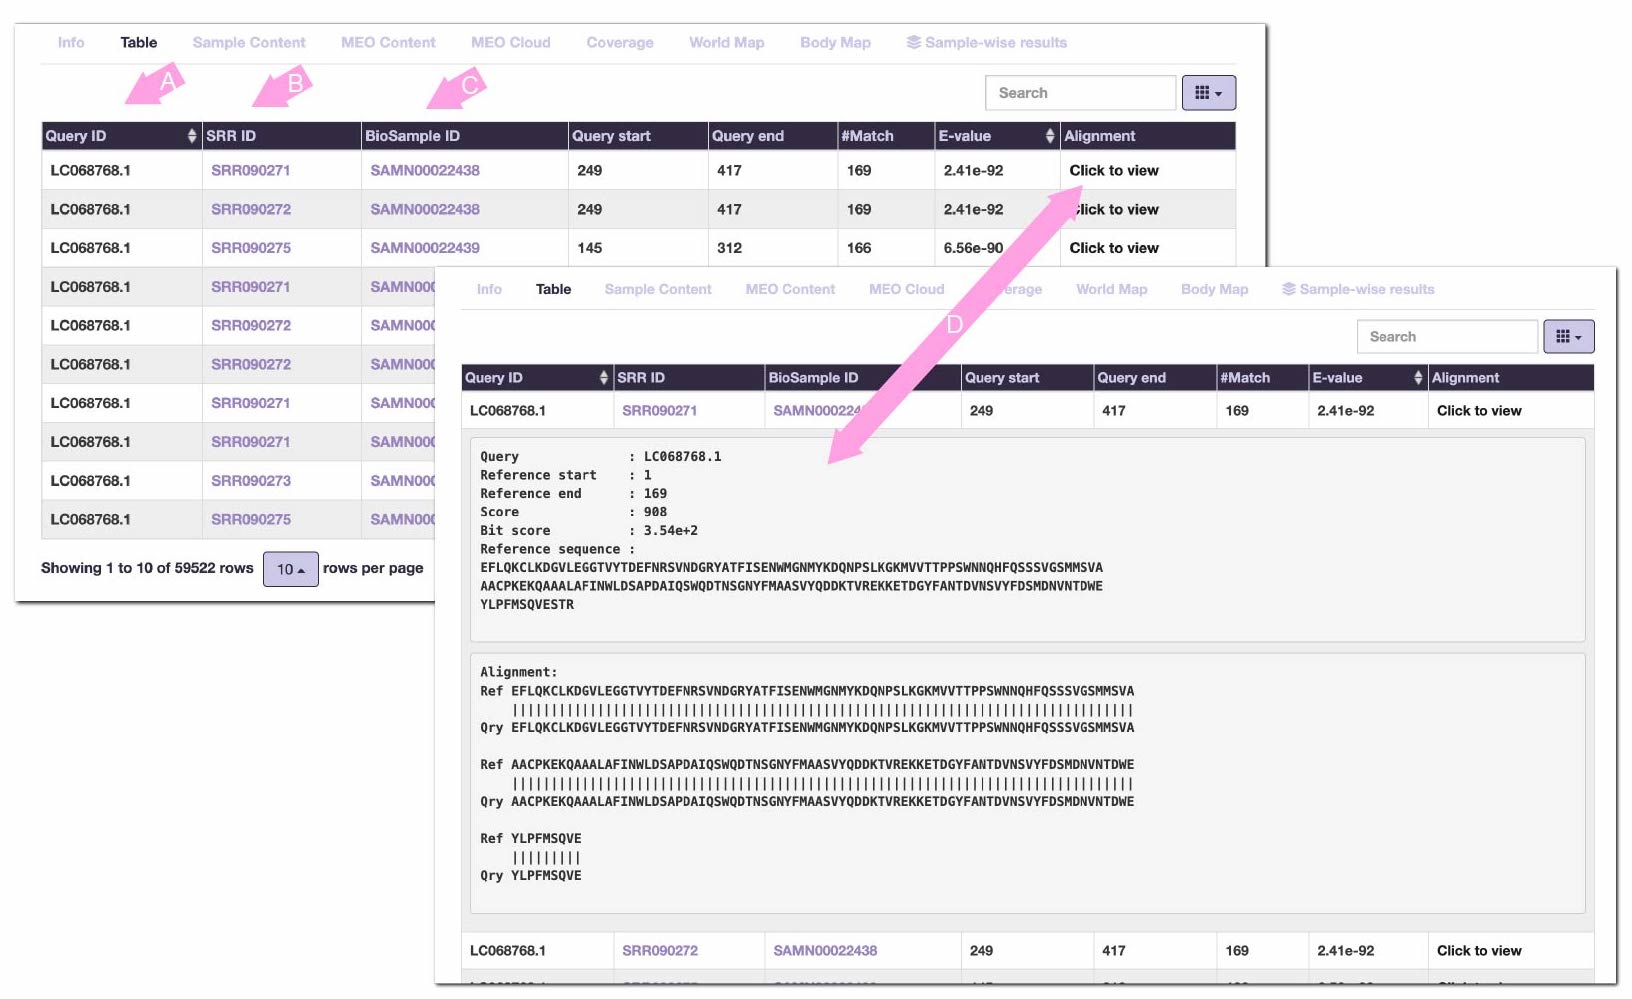
Search results are displayed in a similar tabular format as tools such as BLAST.
By default, hit records are arranged in ascending order of E-value per input sequence.
PZLAST displays "in which sample the sequence was hit" instead of individual sequence hits.
(A) is the ID of the input sequence. Clicking on the header of this column will sort the table by query names.
(B) is the SRR accessions of metagenomic samples. Click to jump to the corresponding page of NCBI Sequence Read Archive .
(C) is the corresponding BioSample ID. Click to jump to the corresponding page of NCBI BioSample .
(D) For each record, expand the reference protein sequence that the query hit, and the alignment details.
The letters in the alignment mean the following:
'|' ... Match
':' ... BLOSUM62 score > 0
'.' ... BLOSUM62 score = 0
'*' ... BLOSUM62 score < 0

- Sample content
-
Subsequent pages show the results for **each** query sequence.
To switch the query, press the button (A) and select the query for which you want to display the results.
This page summarizes the number of hits for each metagenomic sample. A bar chart shows how many sequences in each sample were hit by the query.
Click on the sample ID (B) to jump to the corresponding page on NCBI BioSample to learn more about the sample.
By default, all hits are counted, but you can limit the aggregation to only the top hits.(C)
In addition, it is possible to switch to displaying the percentage of hit sequences in each sample instead of the number of hits.(D)(E)

- MEO content
-
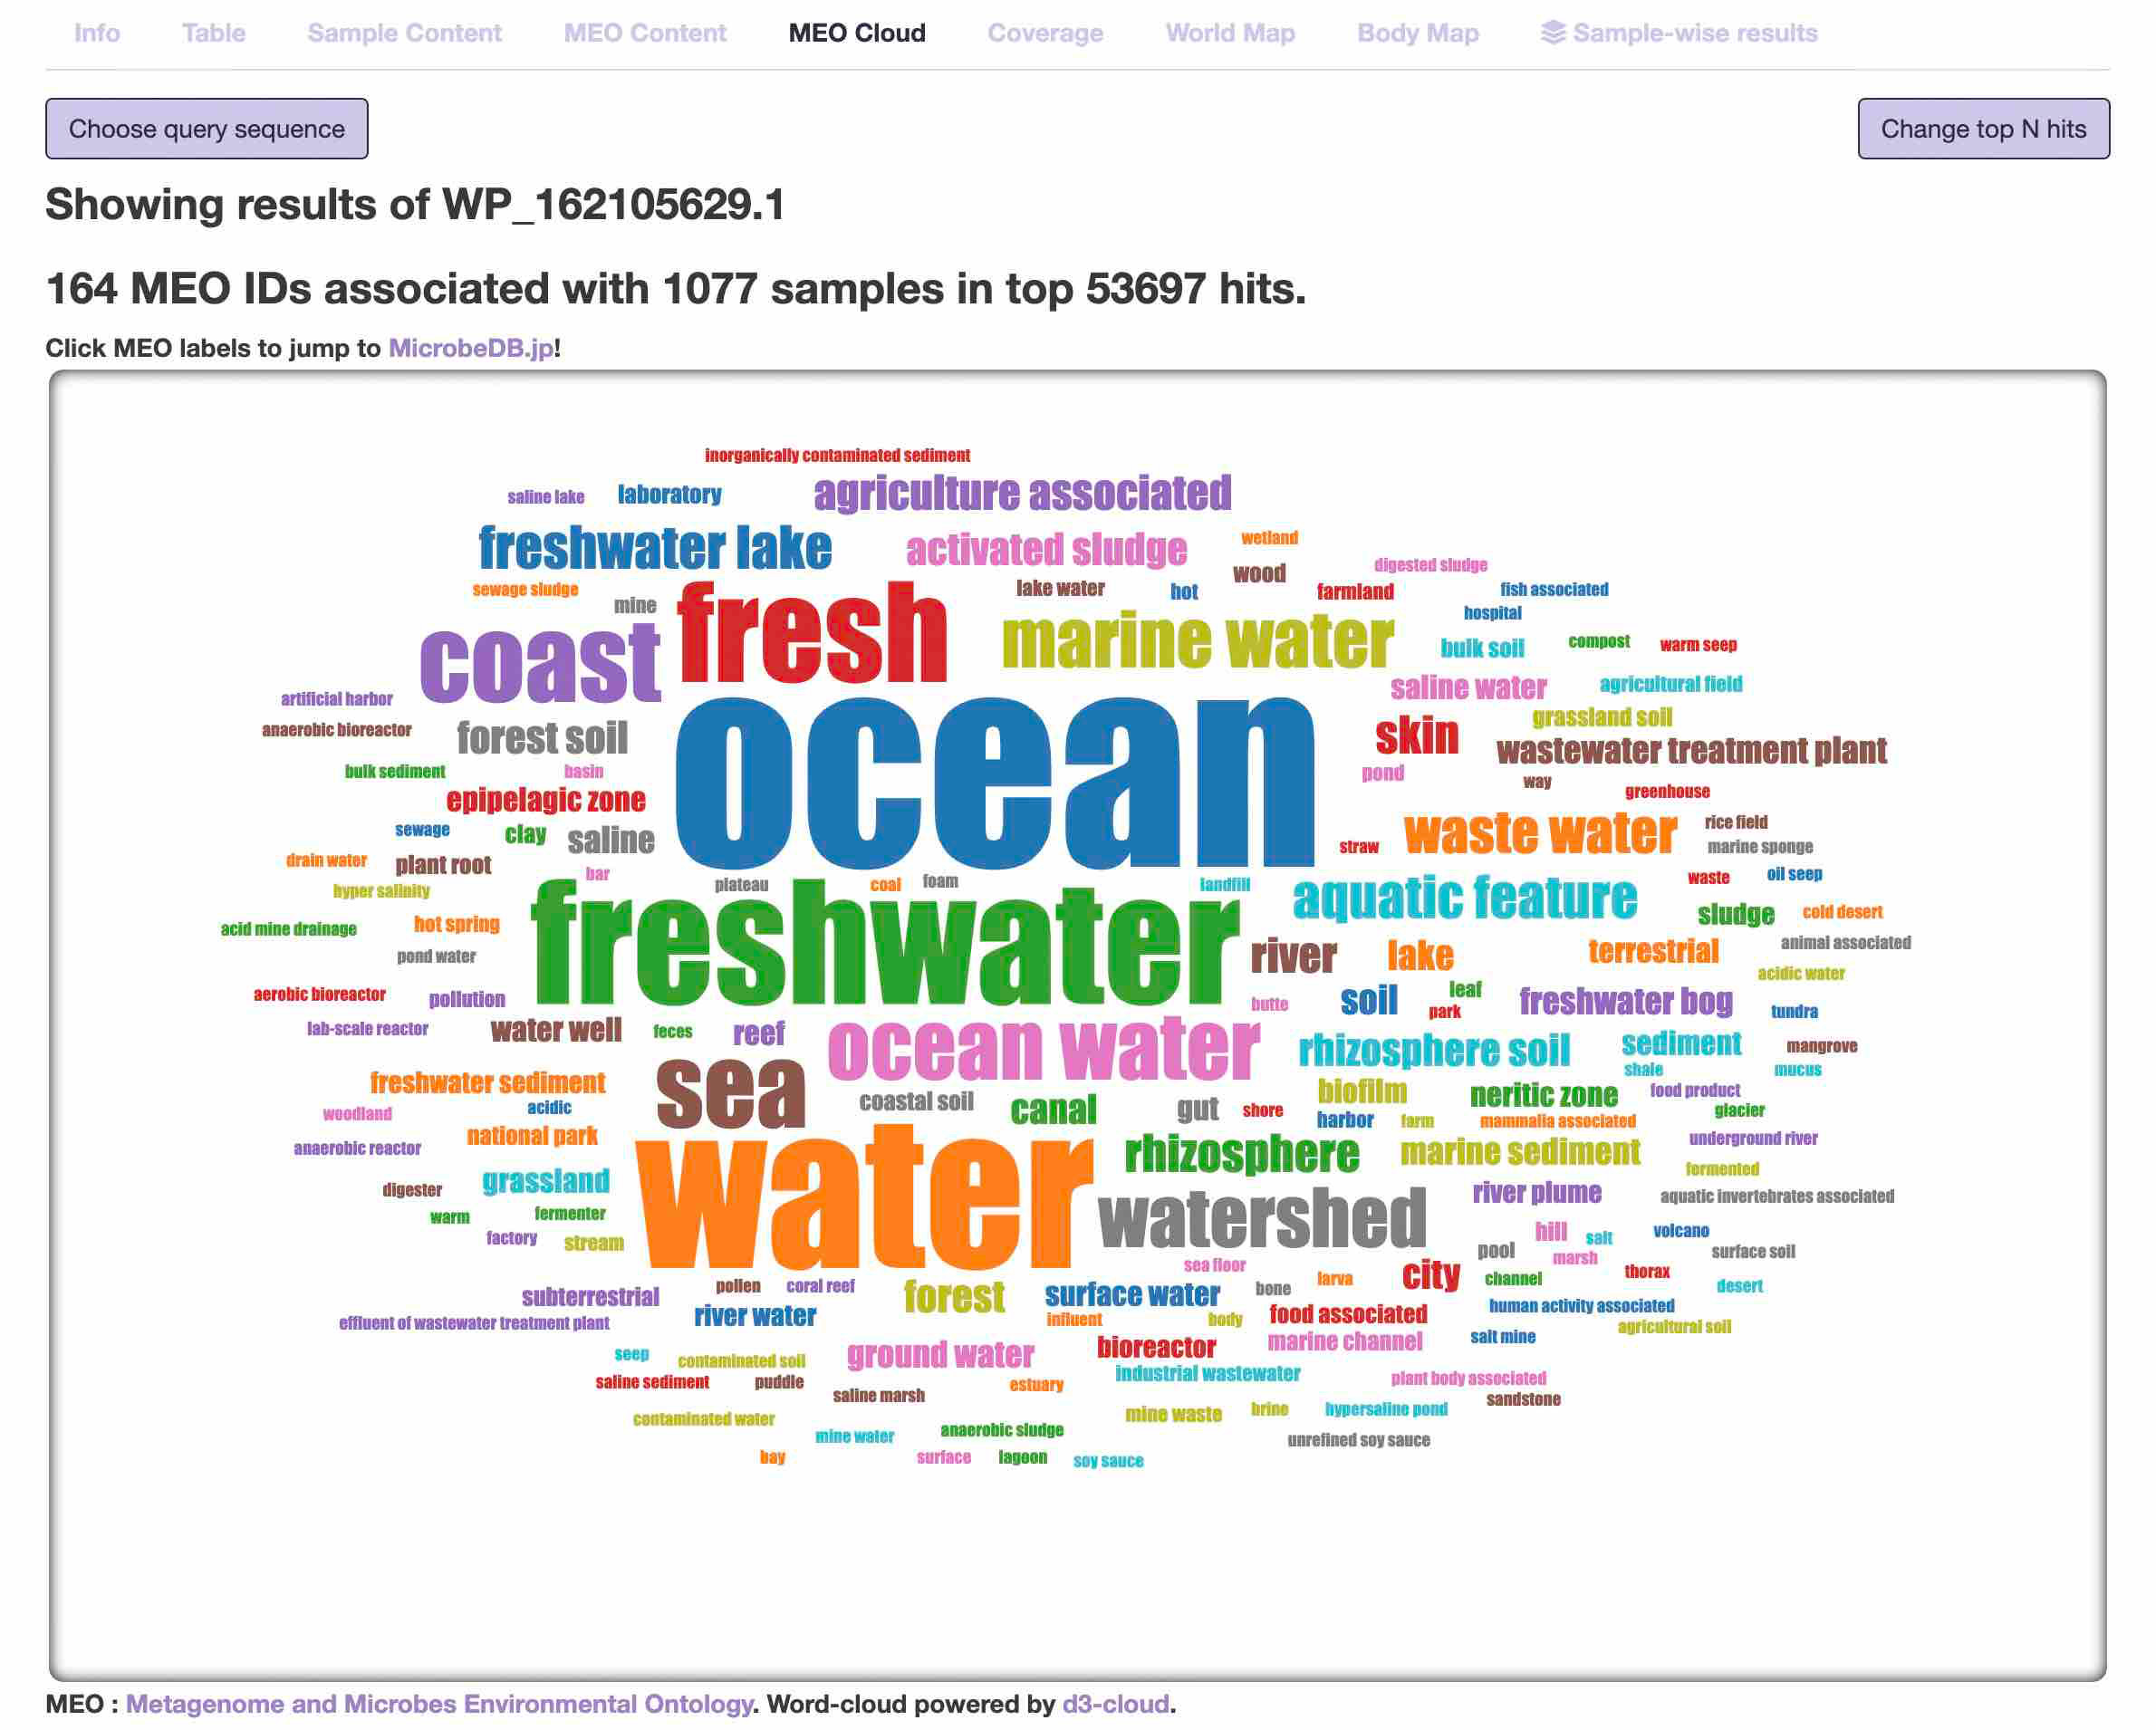
In MicrobeDB.jp, all metagenomic samples are annotated by MEO (Metagenome and Microbes Environmental Ontology).
MEO is a unified ontology describing what natural or human symbiotic environment the sample was taken from.
This bar chart shows how many samples associated with a given MEO were hit by the query. (the number of samples, not the number of hits.)
Also, like "Sample content" page, it is possible to switch to the display of the percentage of hit samples among the samples with the MEO.(B)(C)
- MEO cloud
-
It is essentially based on the same information as the "MEO content" page, but displayed in the fancy word cloud.
The size of the MEO vocabulary scales proportionally with the number of hit samples.
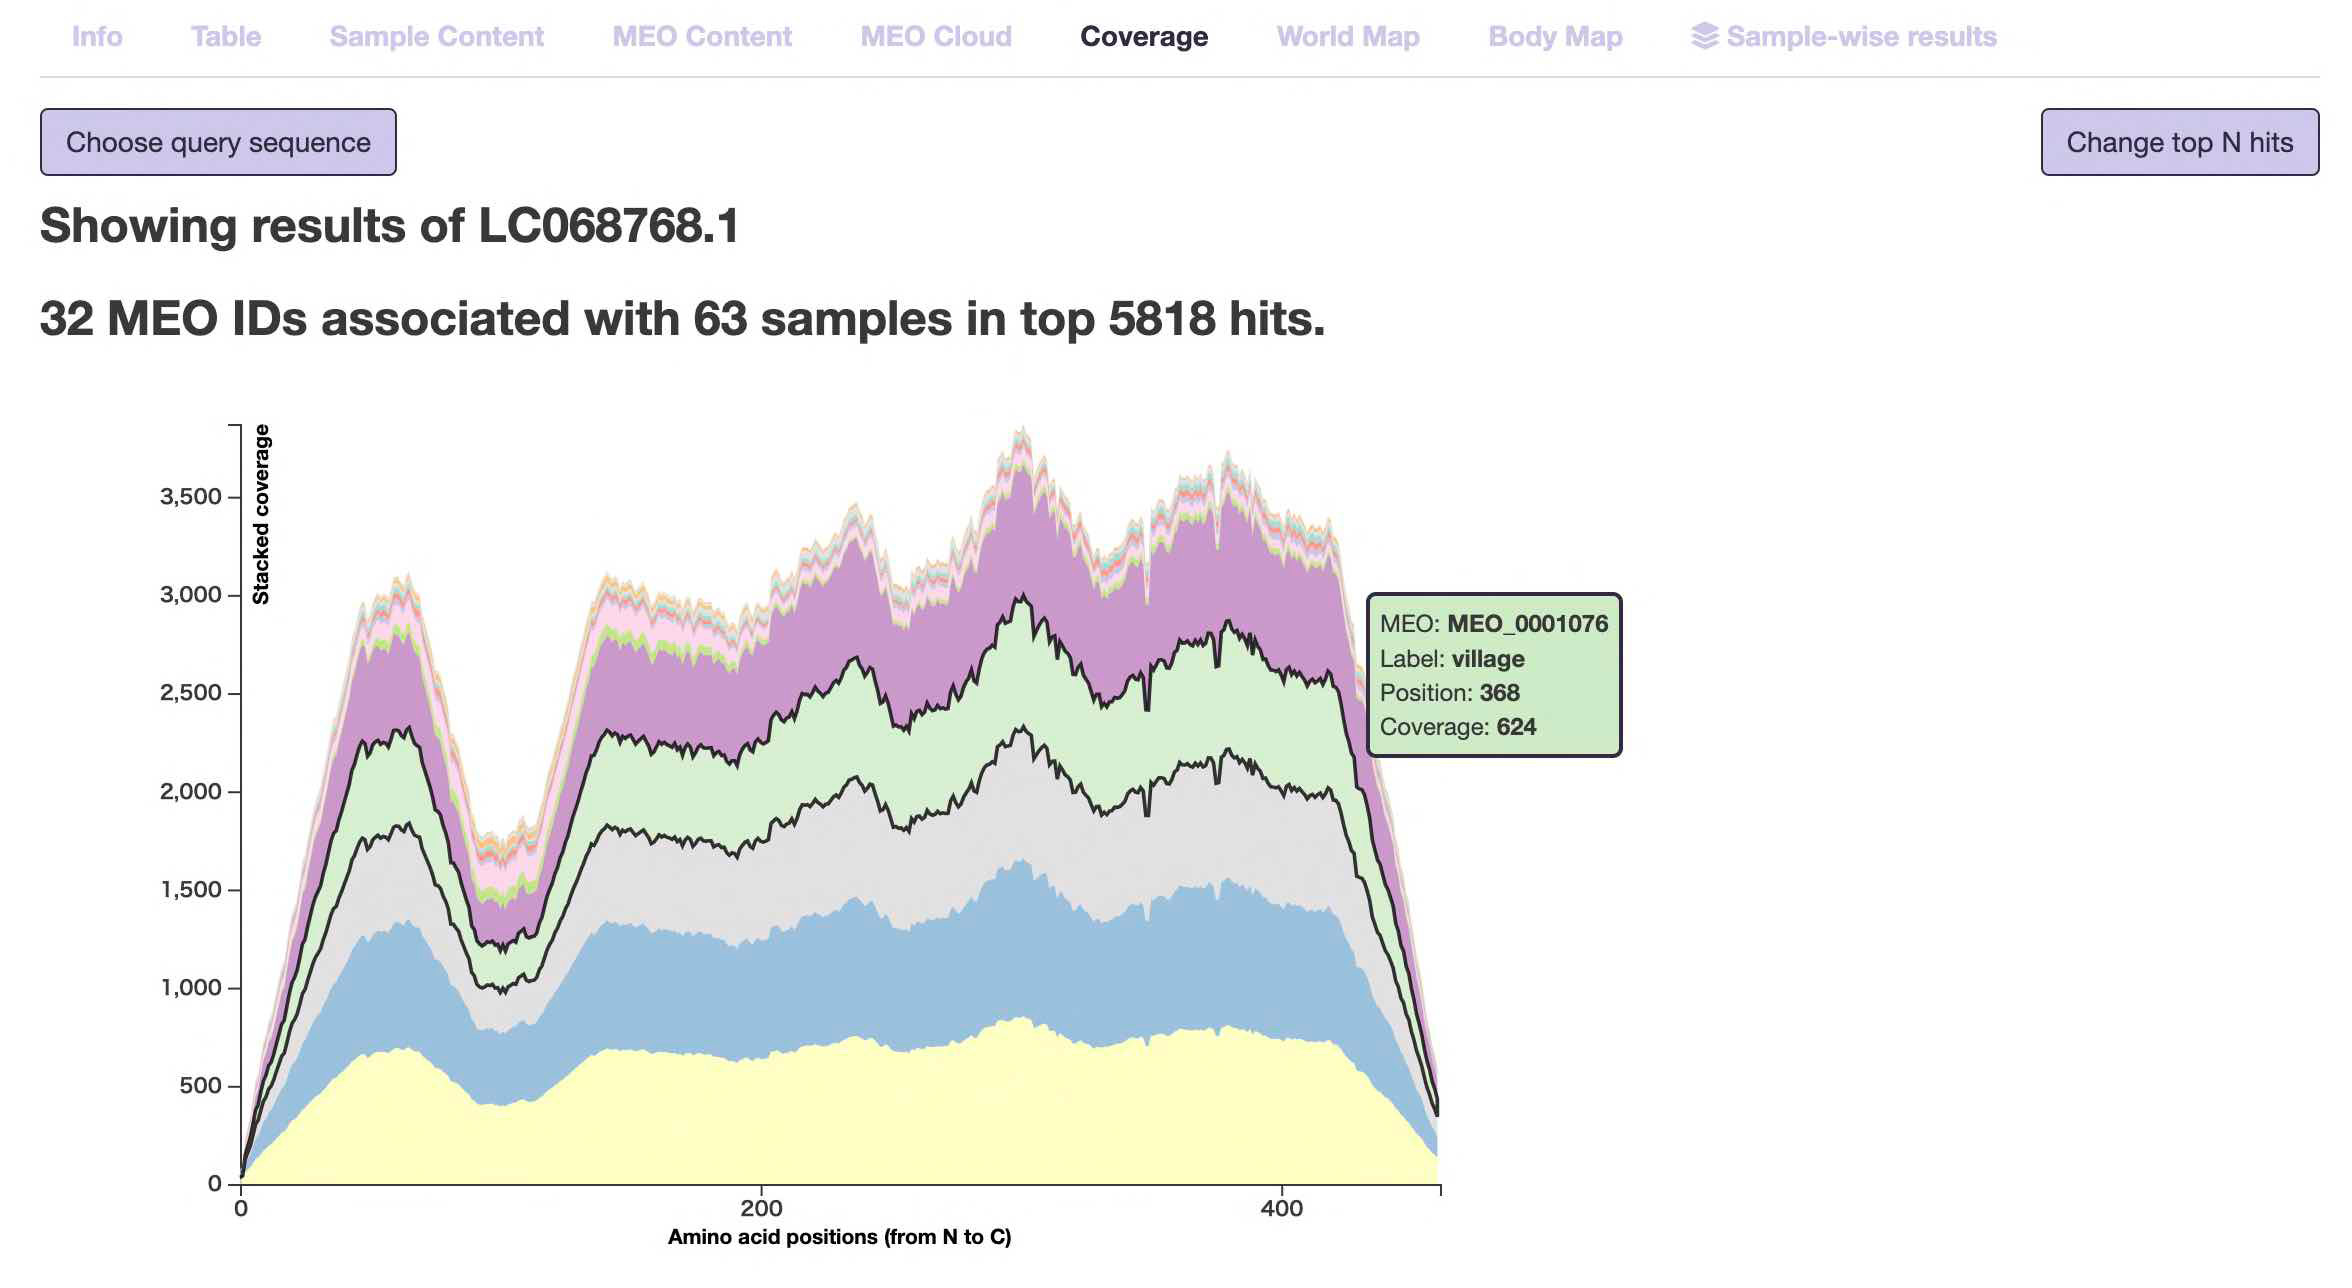
- Coverage
-
This page displays the "environmental coverage" for each amino acid position from the N-terminus (left end) to the C-terminus (right end) of the inputted protein query. This may allow for the discovery of relationships where certain domains are found only in specific environments.
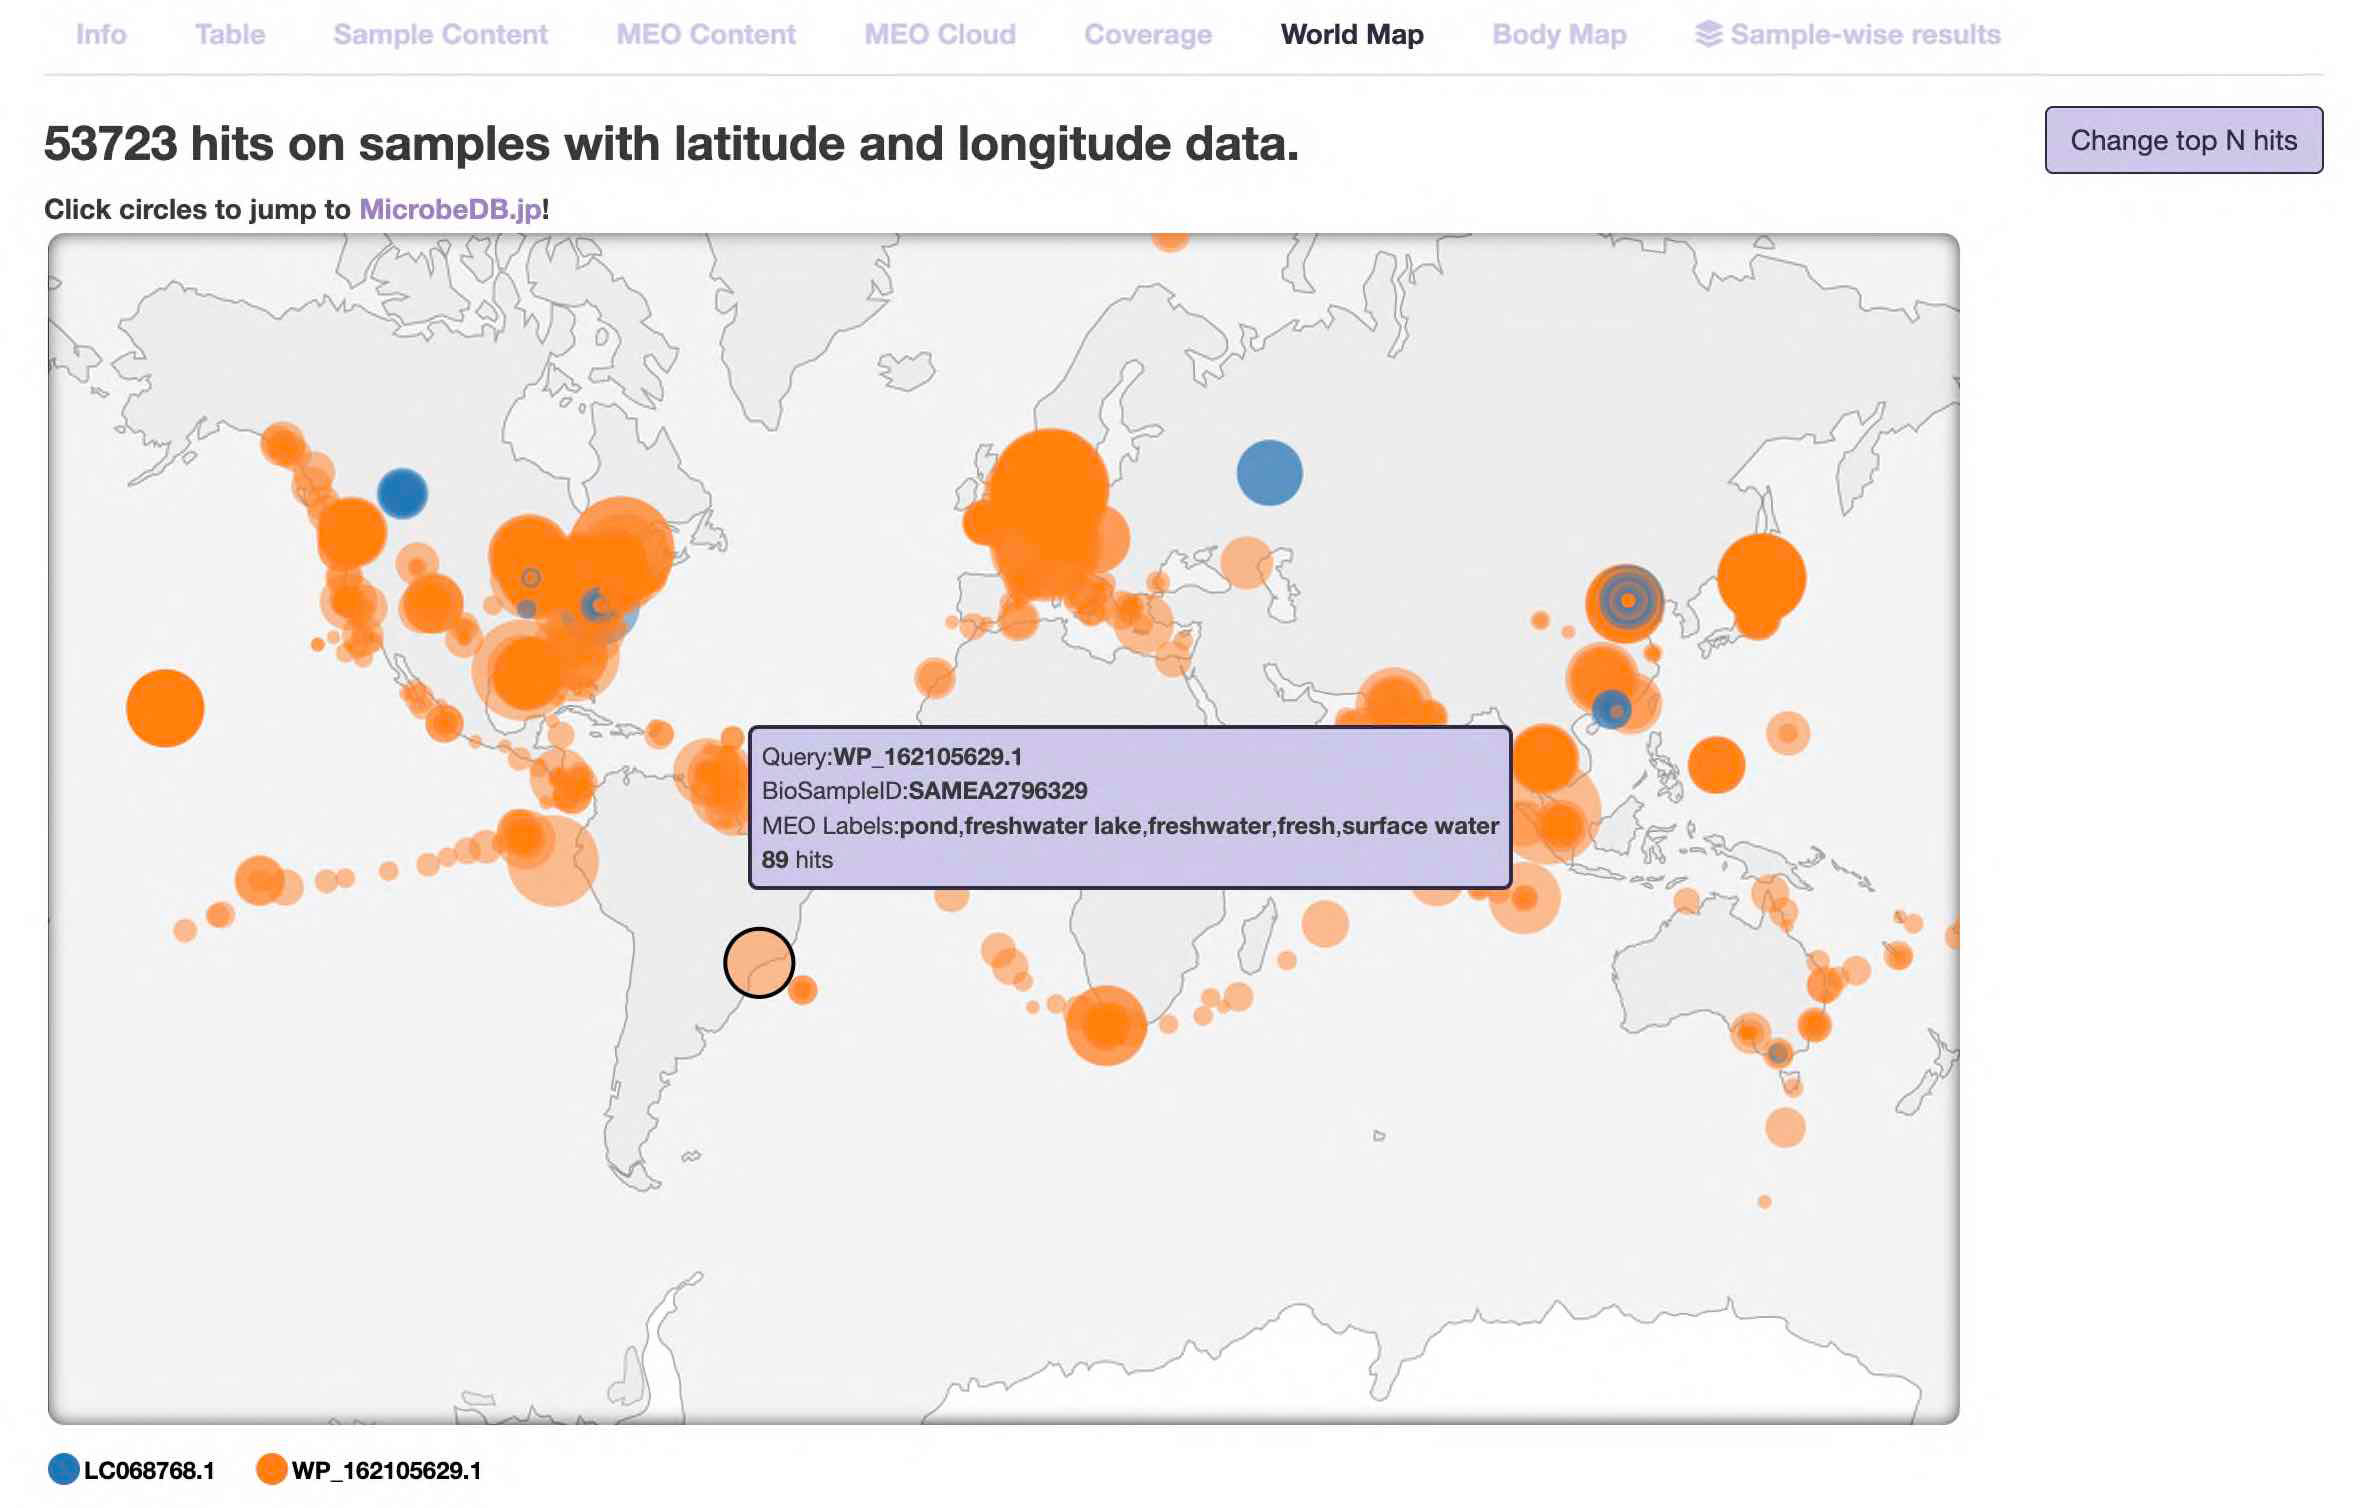
- World map
-
The "locations" of the samples are displayed on the world map.
Note 1: Of the hit samples, this chart displays only the samples for which latitude and longitude information is registered.
Note 2: Latitude and longitude information is described by each researcher when registering it in the public database. It does not necessarily indicate where the sample was taken or where the subject lives.
The more hits the sample has, the bigger the circle is.
On this page, information for multiple queries is displayed at the same time. Different colored circles correspond to different queries (see the legend at the bottom left).
Mouse over the circle to see the information of the sample, such as MEO labels.
Click the circle to jump to the corresponding sample page of NCBI BioSample.
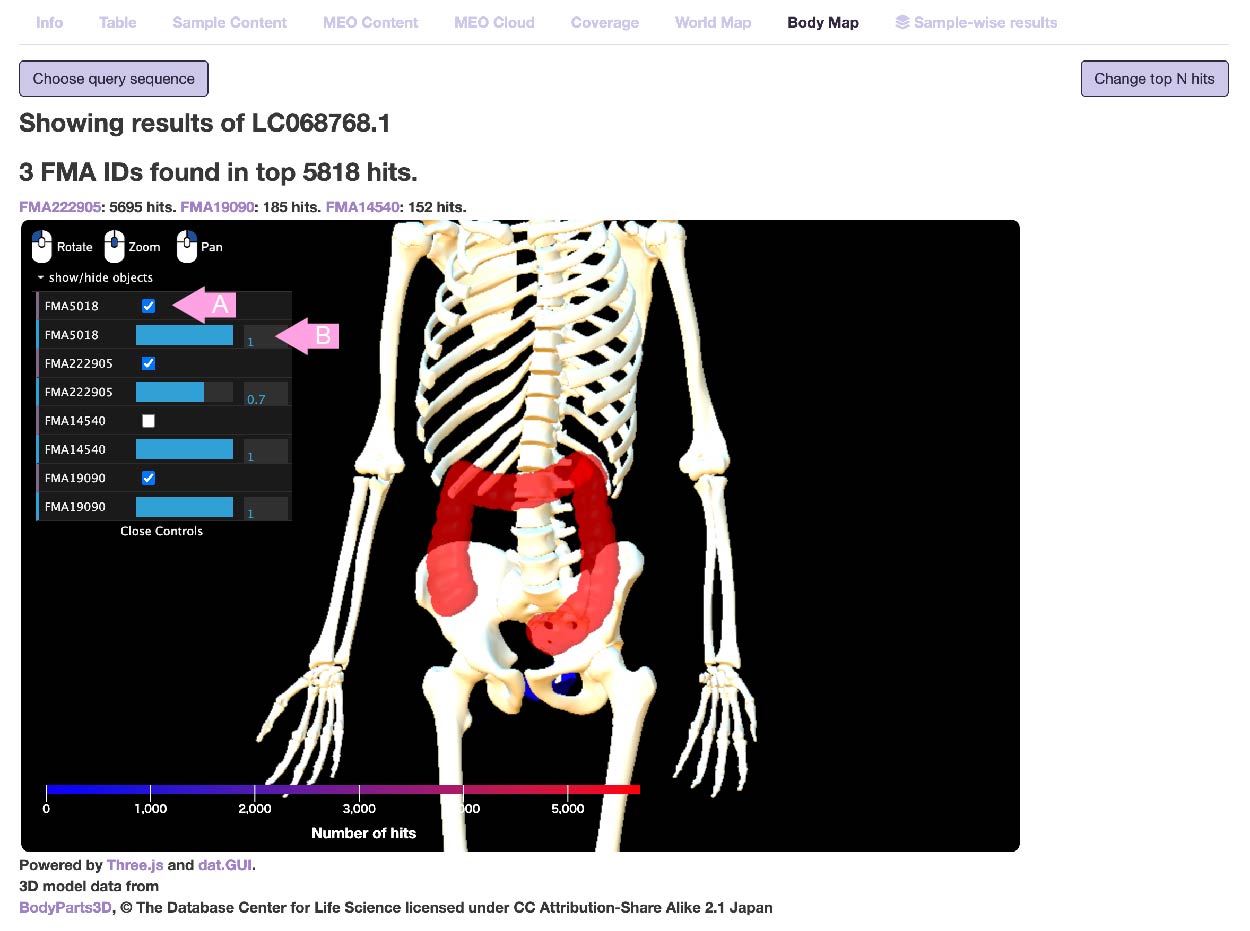
- Body map
-
Some human-derived metagenomic samples have FMA (Foundational Model of Anatomy Ontology) ID.
Here, of the samples where the query hit, the human-derived environment is displayed using the BodyParts3D model.
Note: The metagenomic sample does not necessarily target the organ itself. Human fecal samples are often associated with the large intestine.
The higher the number of hits in the sample associated with that organ, the more red the organ will be.
Only bones are always visible, but other organs that have no-hit are not displayed.
Left click to rotate, right click to pan, mouse wheel to zoom.
Using the control panel on the left, you can switch the visibility (A) and adjust the transparency (B) of each displayed organ.
3. Sample-wise results (Experimental)

- Completion table
-
In the following pages, instead of displaying individual results for hits of the query sequence to specific sequences in a sample, aggregated results based on the total number of hits per metagenomic sample are shown.
Clicking on (A) displays the results page related to "Sample-wise results."
On this page, metagenomic samples that hit are sorted and displayed based on the "Completion ratio" of multiple protein sequences queried in Multi-FASTA format.
Here, the completion ratio refers to the proportion of the multiple query protein sequences found together in the same metagenomic sample, with a sample considered "found" if at least one sequence hits.
This feature enables, for example, the identification of metagenomic samples in which multiple enzyme protein sequences constituting a certain metabolic pathway are collectively found.
(B) indicates the presence or absence of the query protein in each sample. (C) represents the Completion ratio of each sample.
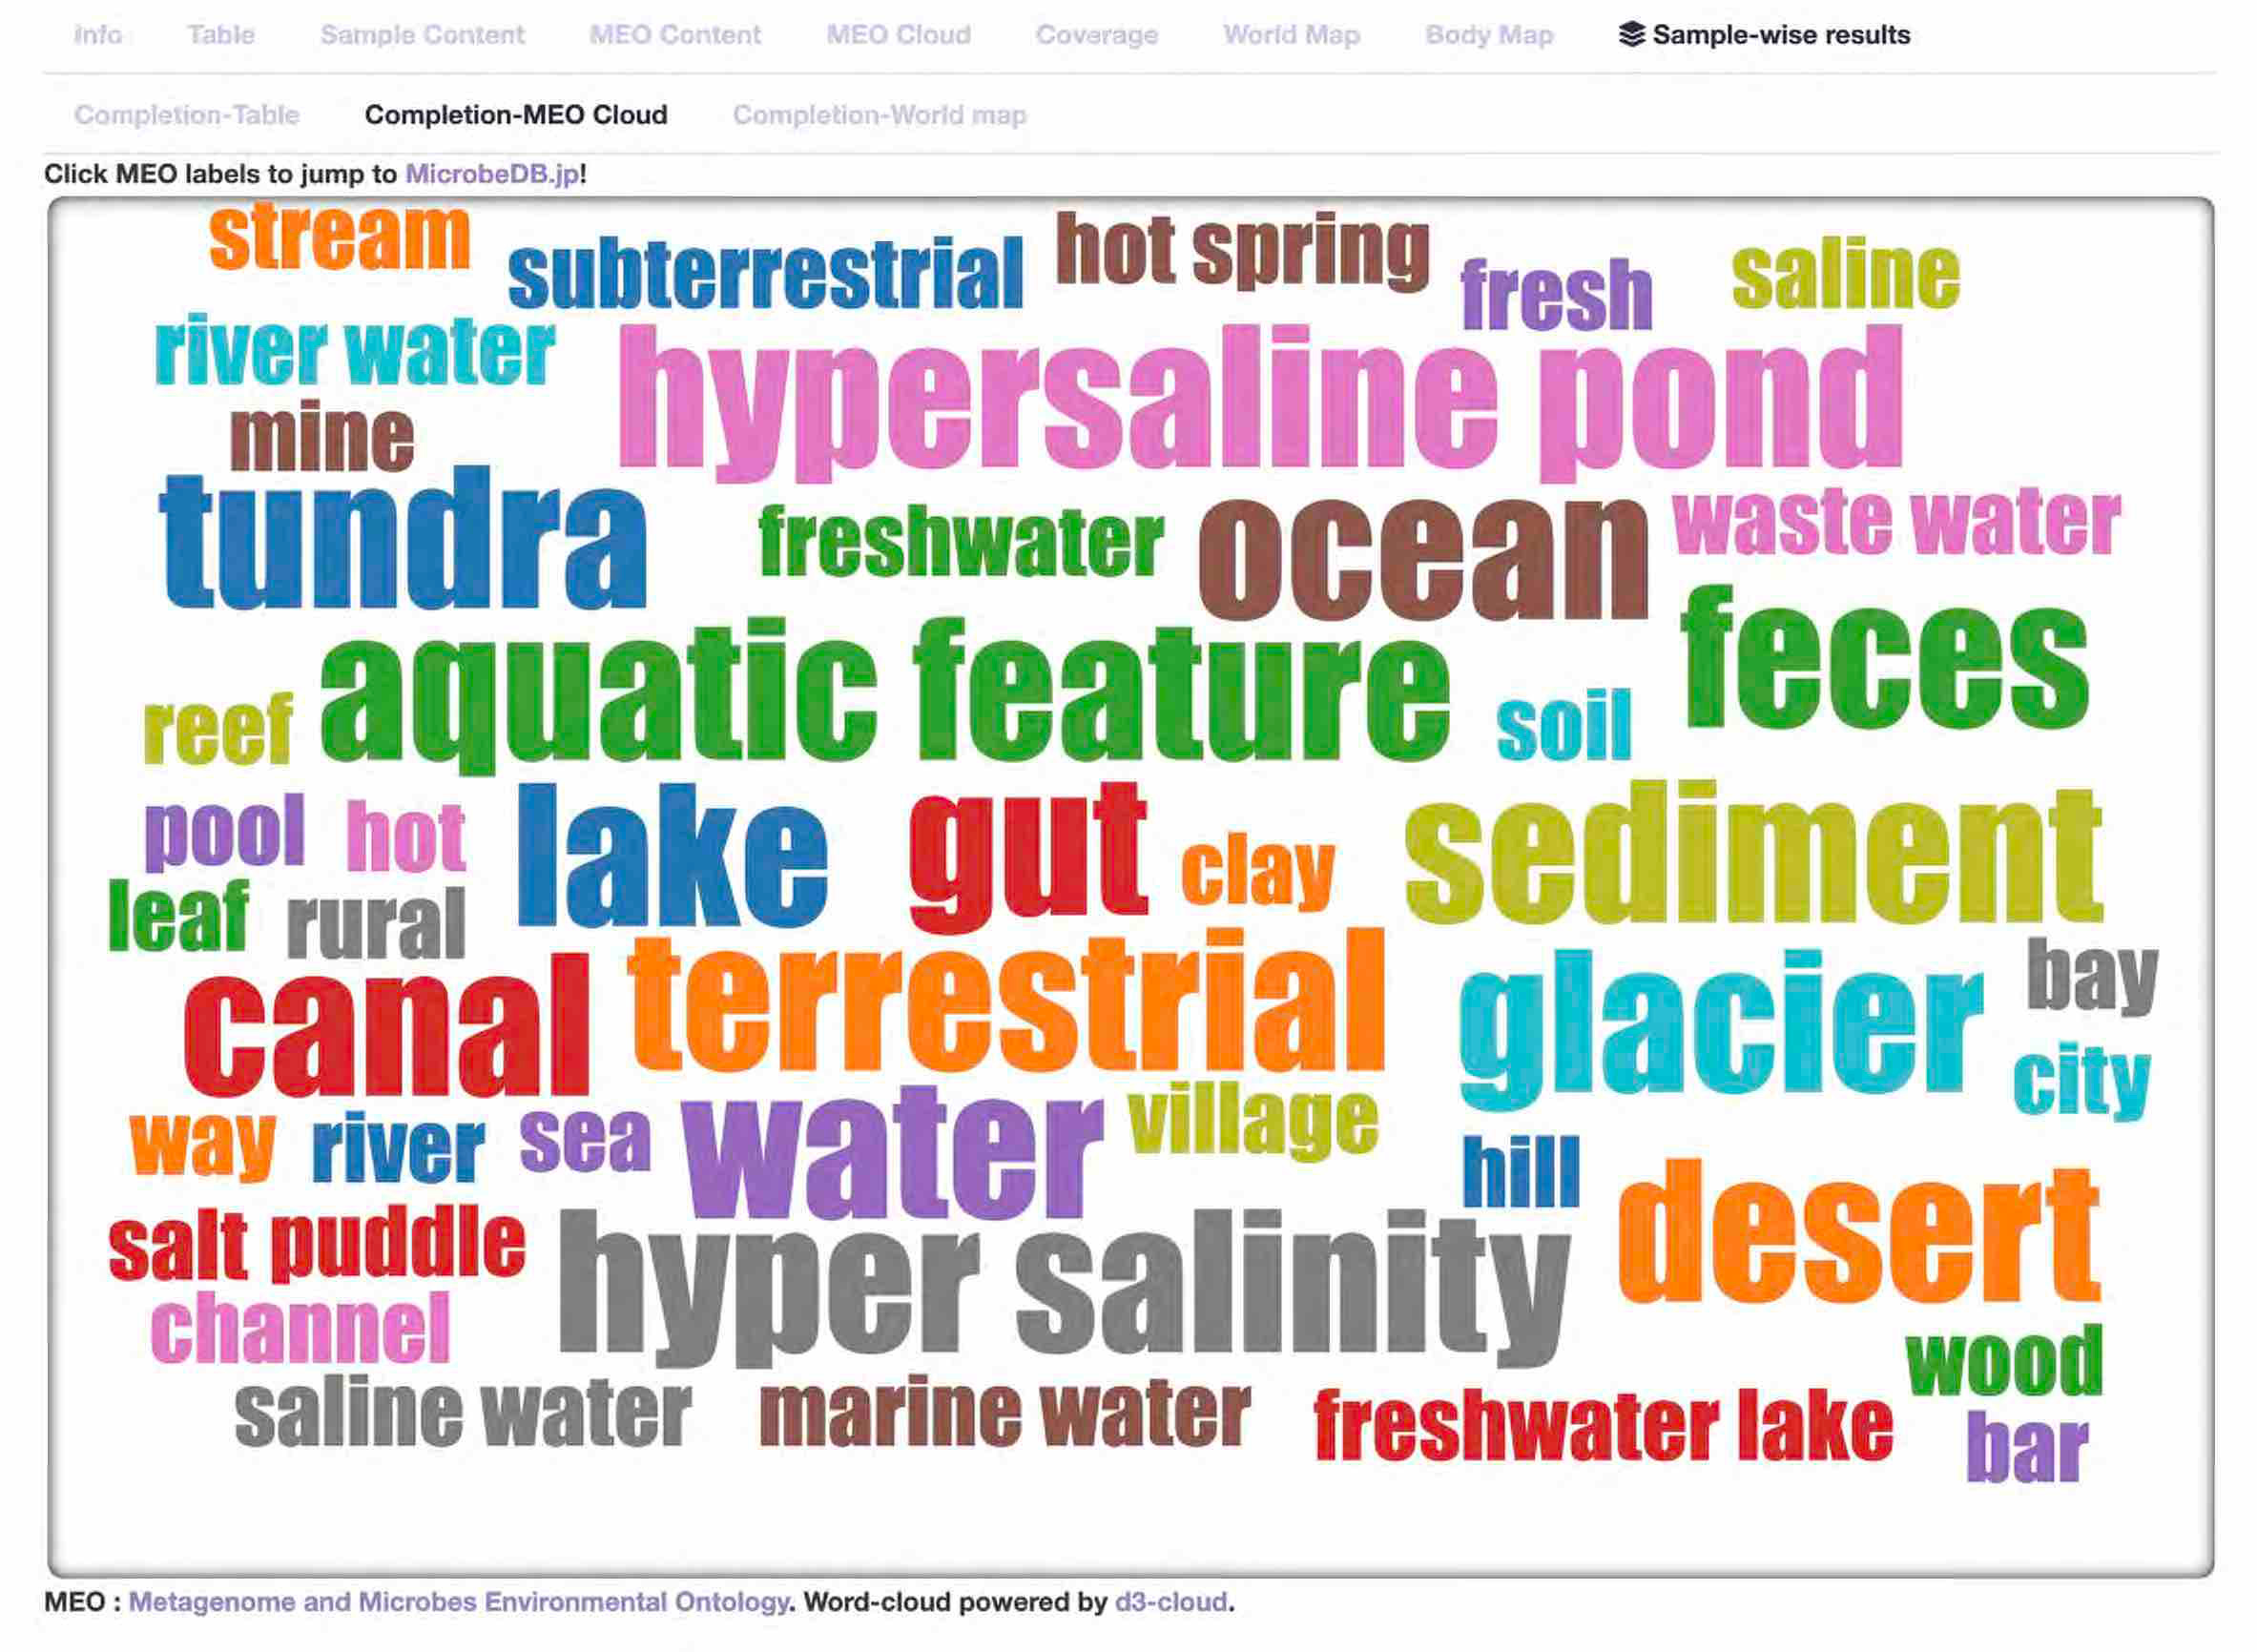
- Completion-MEO Cloud
-
Environments with a high completion ratio are displayed in a word cloud, where the size of MEO vocabulary scales proportionally to the completion ratio.
Initially, each metagenomic sample is weighted according to its completion ratio, followed by calculating the weighted sum of MEO vocabulary present in those samples.
This scaling determines the size of the MEO vocabulary, indicating that environments displayed larger are those where the input sequences are more likely to be observed simultaneously.
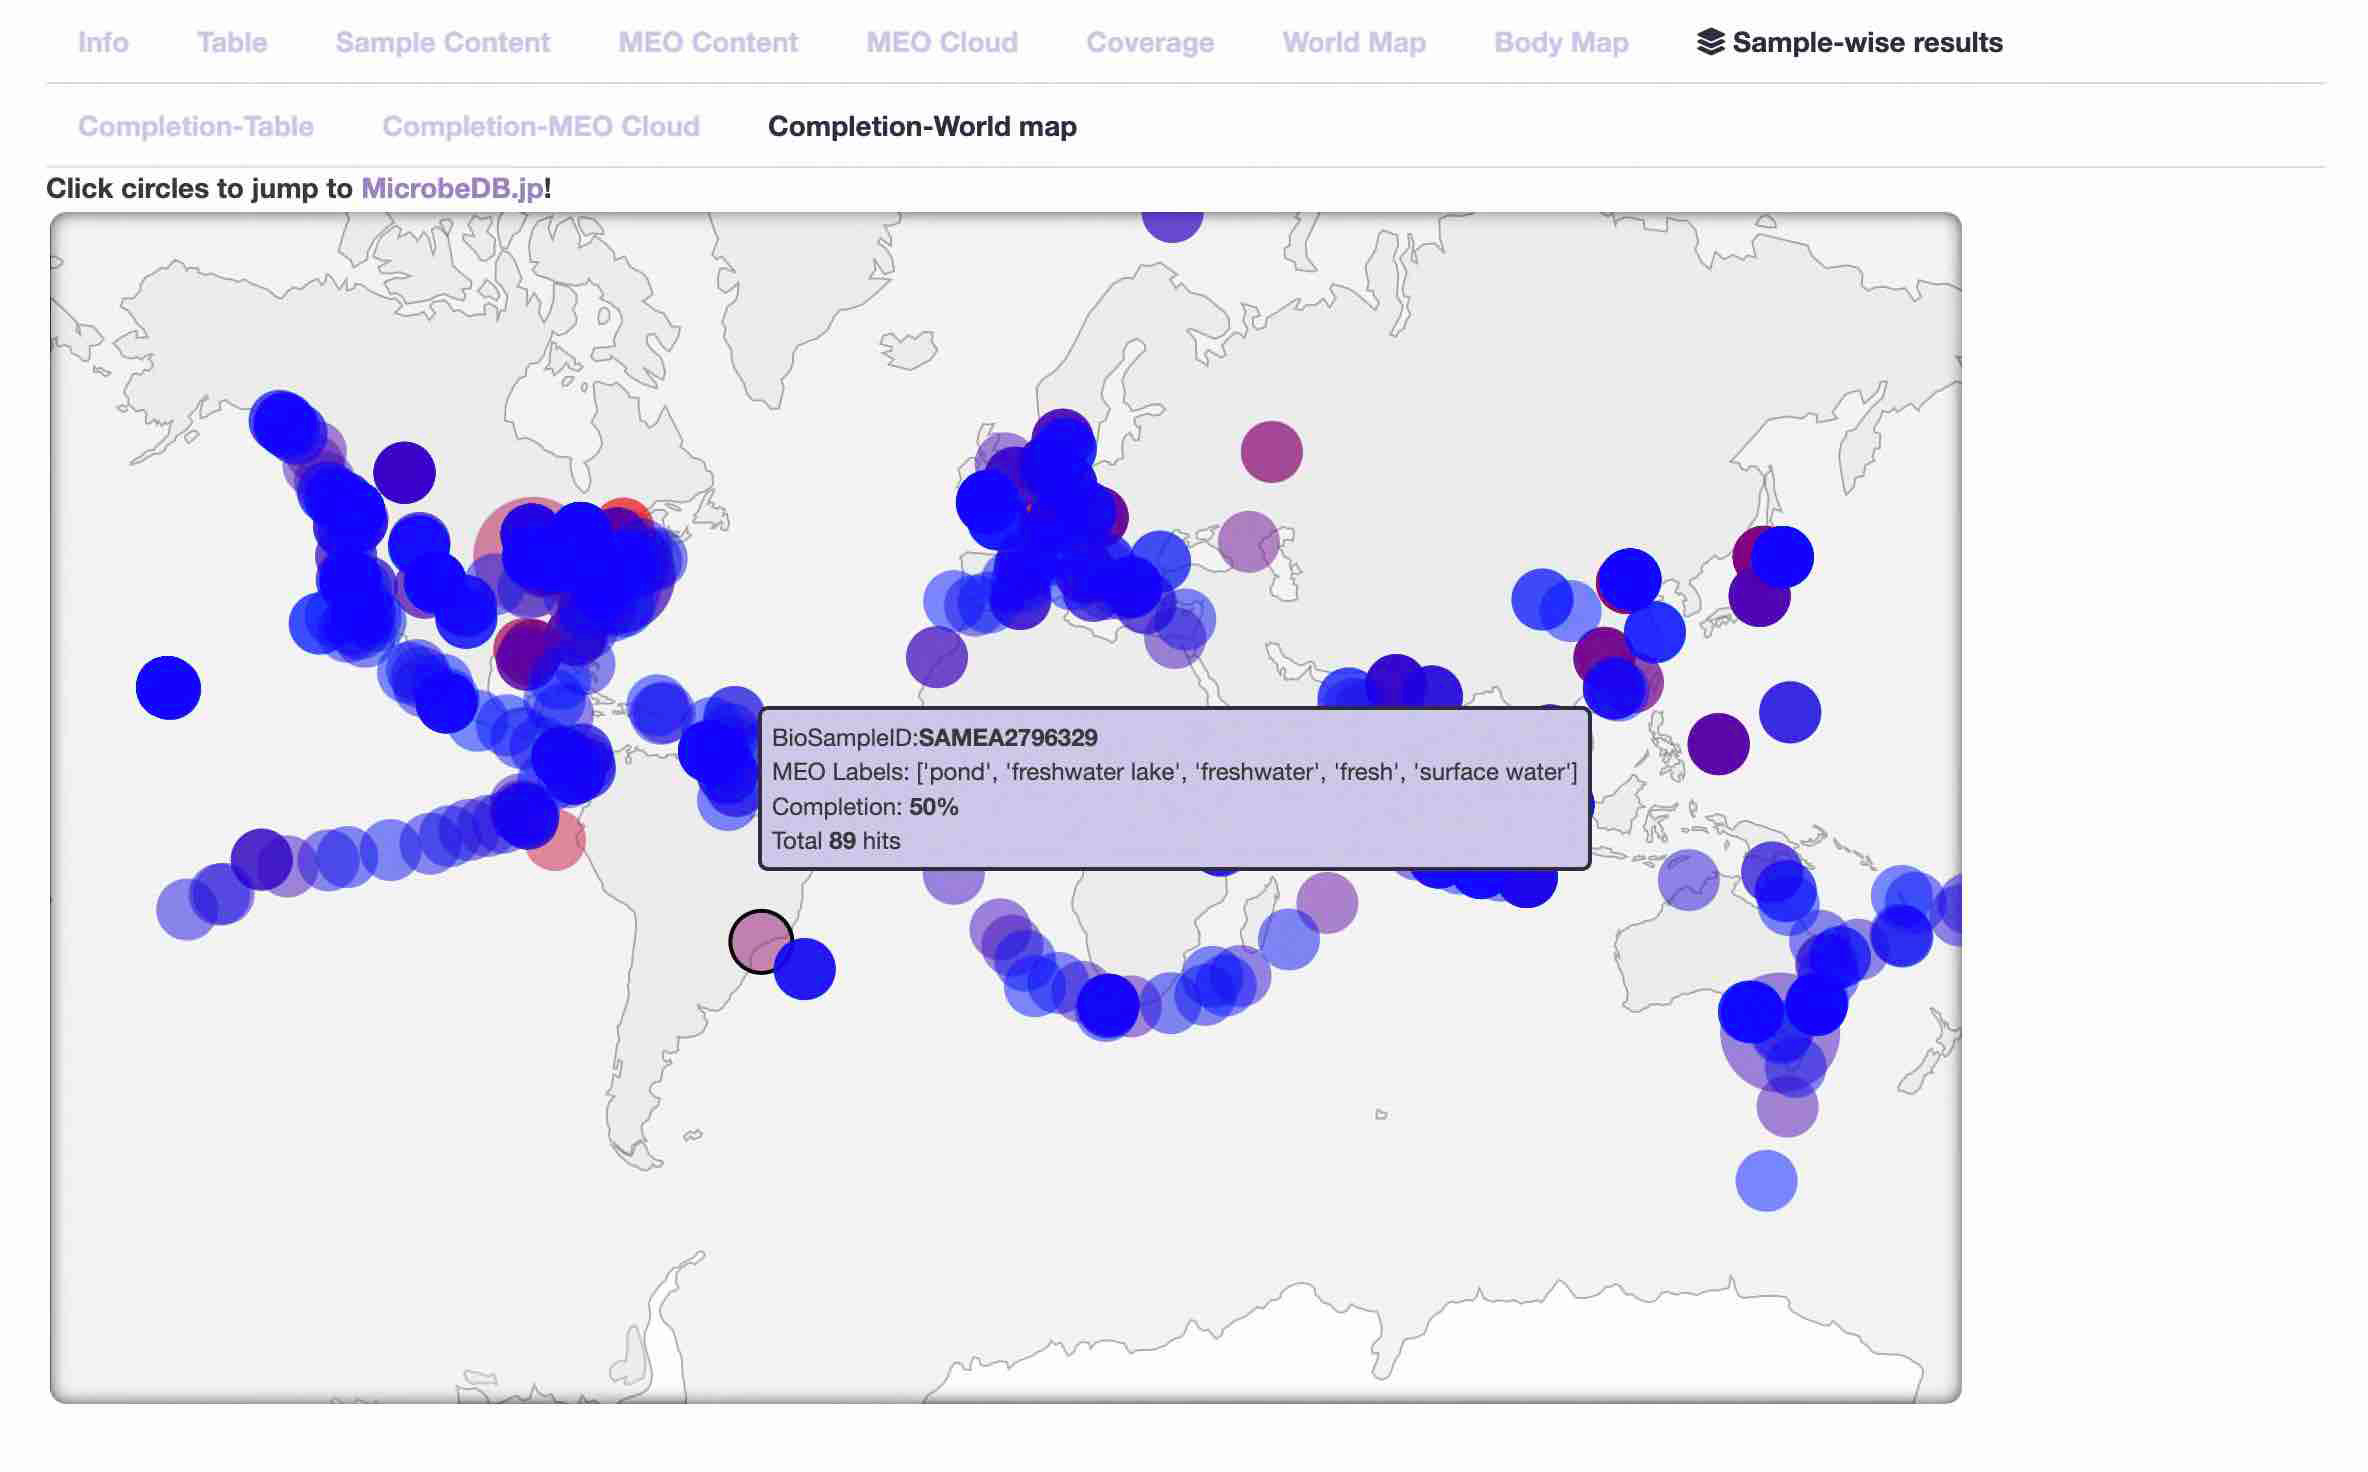
- Completion-World map
-
The locations of samples with high completion ratio are displayed on a world map.
The larger the circle, the higher the completion ratio of the sample, and the closer the color of the circle is to red, the larger the average number of hits for the query proteins.